
US solar and battery capacity 2026: what was operating by midyear
US solar and battery capacity additions in 2026: EIA data shows 11.5 GW of solar and 8.3 GW of batteries operating by the end of June.
The US added 11.5 gigawatts of utility-scale solar and 8.3 gigawatts of battery capacity during the first half of 2026, according to preliminary federal inventory data. That is less than half of the capacity developers expected to add over the full year, but construction is rarely spread evenly across the calendar.
At the start of the year, the US Energy Information Administration (EIA) expected a record 86 gigawatts of new utility-scale generating capacity in 2026. Solar accounted for 43.4 gigawatts of that plan and batteries another 24 gigawatts. The June inventory provides the first useful halfway check on how much of that pipeline had reached operation.
What had entered operation by June
| Technology | Operating additions, January to June | Projects entering operation | Original full-year plan |
|---|---|---|---|
| Utility-scale solar photovoltaic | 11.5 GW | 207 | 43.4 GW |
| Battery storage | 8.3 GW | 95 | 24.0 GW |
| Solar and batteries combined | 19.8 GW | 302 | 67.4 GW |
The operating figures come from the EIA's June 2026 inventory of generators with at least one megawatt of capacity. They cover utility-scale projects that reported entering commercial operation during the first six months of the year. Rooftop solar and small batteries are outside this inventory.
Solar additions were strongest in April and June, when 3.0 gigawatts and 2.4 gigawatts respectively entered operation. Battery additions reached 2.7 gigawatts in June, the largest monthly total in the first half. The monthly pattern is uneven because commissioning dates move with construction, grid connection and testing rather than arriving at a steady rate.
The record-year forecast is still a pipeline
The 43.4-gigawatt solar figure and 24-gigawatt battery figure describe planned additions, not completed installations. Developers report expected operating dates to the EIA, and those schedules can move. Projects may enter service later than planned, change capacity or leave the pipeline entirely.
By the end of June, operating additions were equivalent to about 26% of the original full-year solar plan and 34% of the battery plan. Those percentages should not be read as a target score. Large projects often cluster late in the year, and the inventory remains preliminary until the EIA completes its annual data cycle.
A development pipeline measures intent and near-term construction activity, while operating capacity can generate or store electricity. Keeping those numbers separate prevents a record announcement from being mistaken for power already available to the grid.
Battery growth is changing the daily power mix
California shows what a larger battery fleet can do once it is connected. Between April 2024 and April 2026, utility-scale battery capacity in the California Independent System Operator (CAISO) area rose by 79% to 16 gigawatts. Utility-scale solar capacity increased by 19% to 25 gigawatts over the same period.
Battery discharge during the first five months of 2026 was three times the level recorded in the same months of 2024. Much of that electricity moved into the evening, when solar production falls and demand remains high. Batteries do not create electricity, but they allow more midday generation to be used later rather than curtailed or sold during low-price hours.
This does not remove the need for transmission, flexible demand or firm generation. Battery duration, location and charging source all affect what storage can replace. The California figures nevertheless show that battery capacity is becoming a visible operating resource rather than a distant project queue.
Solar deployment is spreading beyond California
Texas has become another centre of US solar growth. EIA data shows that solar generation in the Electric Reliability Council of Texas area exceeded coal generation in several recent months, helped by rapid additions of utility-scale projects. The change is especially visible during daylight hours, while gas generation, storage and interconnection carry more of the evening balance.
Nationally, solar's shorter construction cycle has made it the largest part of the 2026 development pipeline. The harder work increasingly sits around the panels: grid studies, interconnection equipment, transmission, local permitting, transformers and enough flexibility to handle large differences between midday and evening output.
That wider system pressure is also visible in the International Energy Agency's forecast for global electricity demand in 2026. More renewable generation is reaching the grid, while data centres, cooling, electric vehicles and industry are increasing the amount of power the system must supply.
What the second half must show
The final 2026 total will depend on how much of the remaining scheduled capacity reaches commercial operation. A strong second half would confirm that the large developer pipeline is translating into physical assets. A weaker result would leave more projects deferred into 2027 or removed from the queue.
Operating capacity is only one measure of progress. Generation data will show how much electricity the new solar fleet produces. Battery charge and discharge data will show whether storage is shifting useful volumes into constrained hours. Curtailment and wholesale-price patterns will reveal where grids still cannot make full use of the buildout.
The first-half figures establish that the expansion is real: nearly 20 gigawatts of utility-scale solar and batteries entered operation in six months. The remaining question is how much of the much larger 2026 plan survives construction, connection and commissioning by year-end.
Know this subject well? Send evidence, corrections or a useful lead to hello@theplanetbrief.com.
Official sources
- US Energy Information Administration: developers plan to add 86 GW of capacity in 2026
- US Energy Information Administration: preliminary monthly generator inventory
- US Energy Information Administration: June 2026 generator inventory workbook
- US Energy Information Administration: California solar and battery capacity
- US Energy Information Administration: Texas solar and coal generation
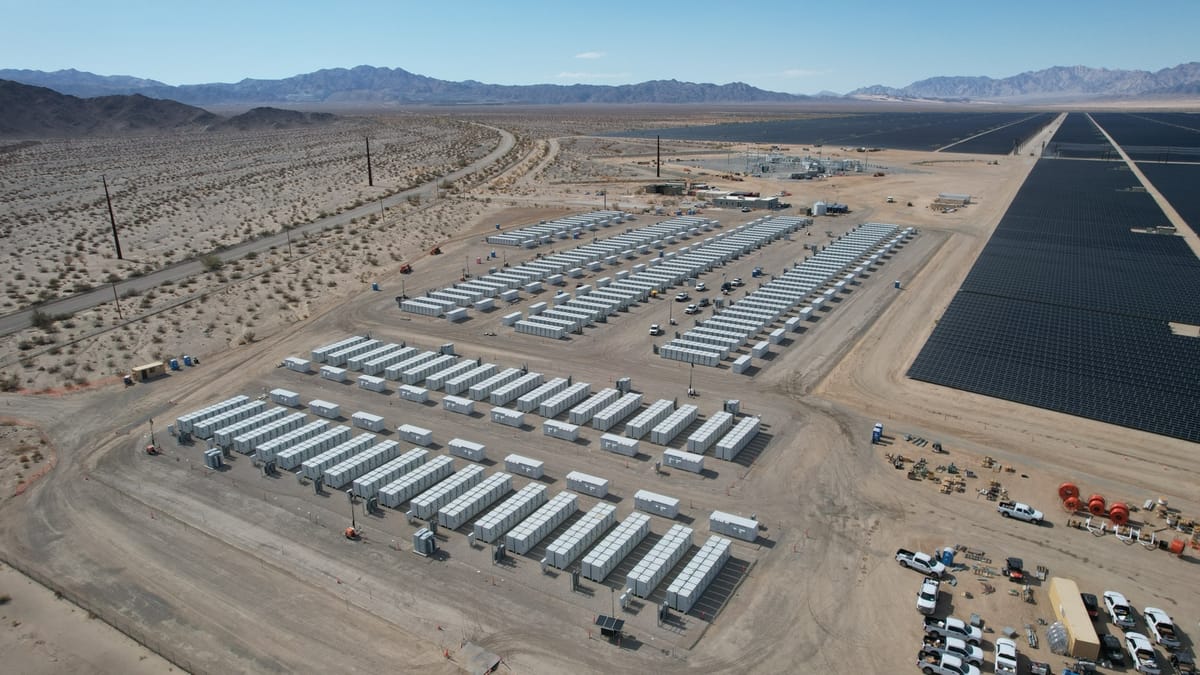
- Feature image: Desert Sunlight Battery Energy Storage System, BLM California, public domain
.jpg)
Data checked
Checked on 30 July 2026 against the EIA June 2026 preliminary generator inventory and the agency's published 2026 capacity forecast. Operating additions were calculated from projects with a 2026 operating month and an operating status in the June workbook. Figures may change as the monthly inventory is revised. Review after the next EIA inventory and again when final 2026 operating-capacity data is published.
Know this subject well? Send evidence, corrections or a useful lead to hello@theplanetbrief.com.