World Cup 2026 climate impact: why travel is FIFA's biggest sustainability test
World Cup 2026 climate impact explained: why travel is FIFA's biggest sustainability test, how heat risk changes the event and what evidence to watch.

The FIFA (Federation Internationale de Football Association) World Cup 2026 is a climate test as much as a sporting event. Its footprint will be shaped by long-distance travel, heat risk, public transport, carbon-credit claims and how much detail FIFA publishes after the final.
This guide is for general information only. It is not legal, regulatory, investment, health or safety advice.
Number to remember
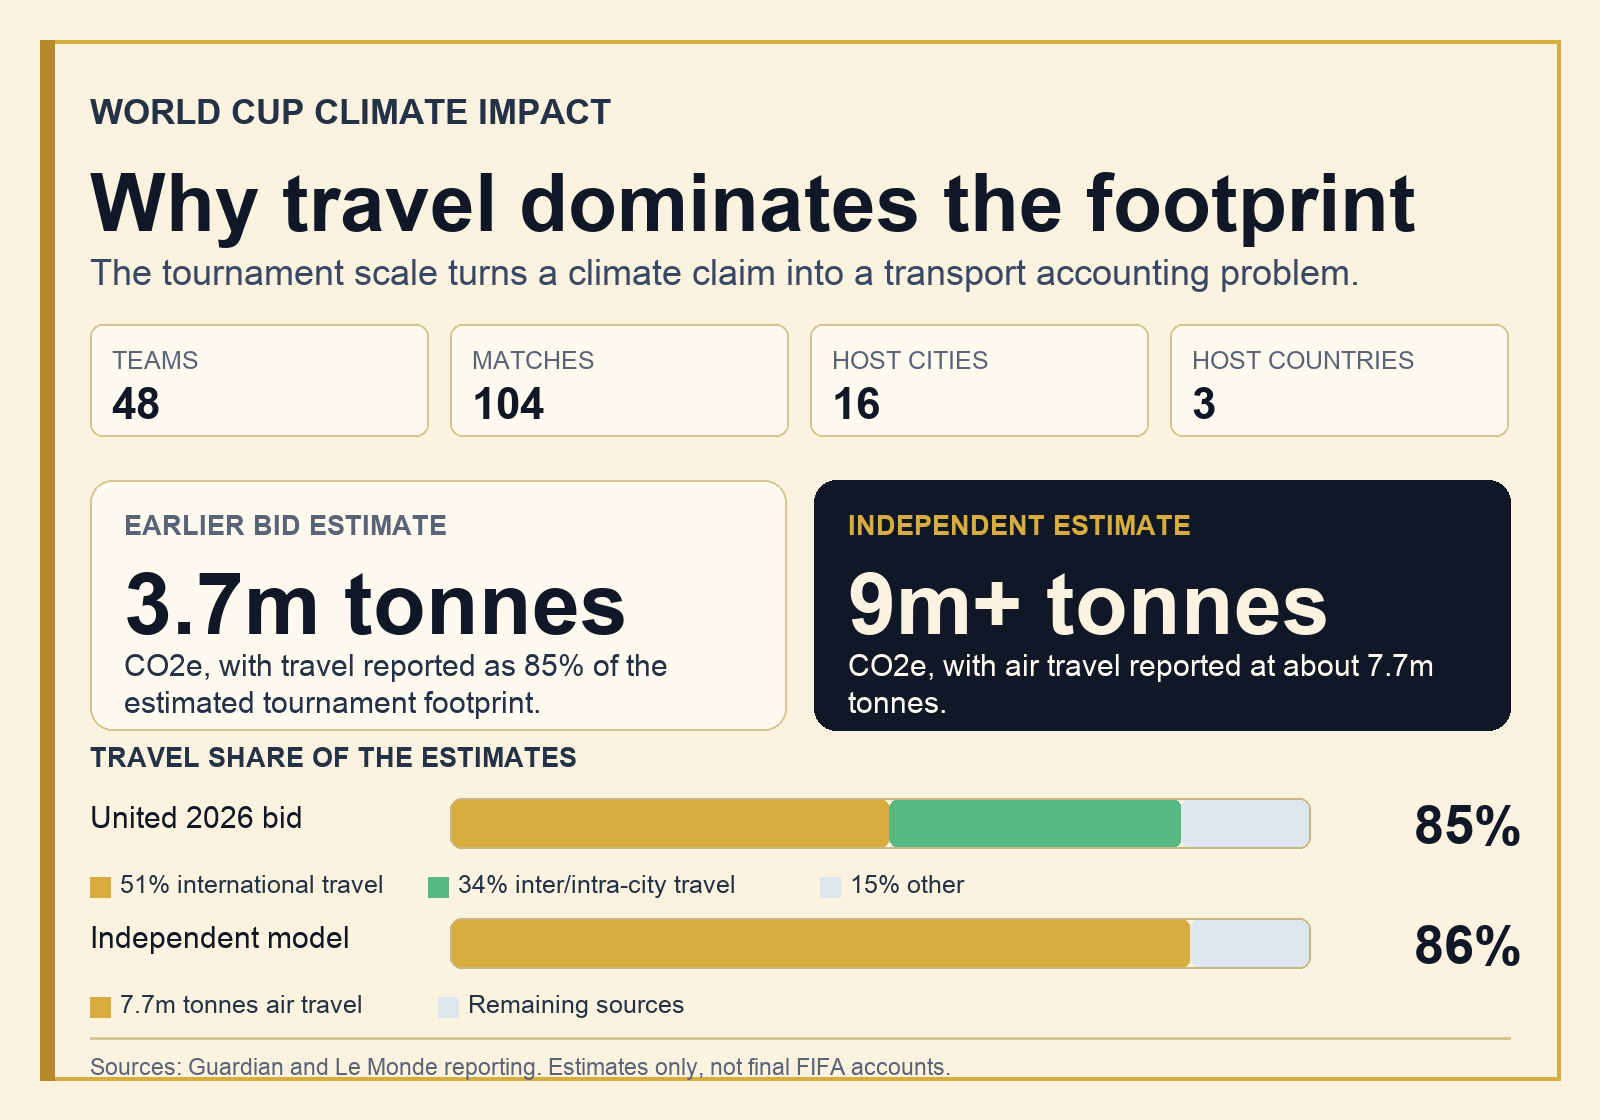
One earlier bid estimate put the tournament footprint at roughly 3.7 million tonnes of carbon dioxide equivalent. Recent independent estimates cited in current reporting are closer to 9 million tonnes, with air travel as the main driver.
The exact figure will not be settled until FIFA publishes post-tournament reporting, but the current estimates already show why the emissions debate is mostly a travel debate.
| Source | Estimate | Boundary | Caveat |
|---|---|---|---|
| United 2026 bid estimate, cited by the Guardian | About 3.7 million tonnes of carbon dioxide equivalent | Estimated tournament footprint, with travel reported as 85% of emissions. | Based on earlier bid assumptions and not a final FIFA account. |
| Scientists for Global Responsibility and Greenly estimates, reported by Le Monde | At least 9 million tonnes of carbon dioxide equivalent | Independent modelling of the expanded 2026 tournament, with air travel reported at about 7.7 million tonnes. | Not an official inventory, but useful as a stress test for FIFA's eventual numbers. |
The climate question around the World Cup is not whether a tournament can ever be impact-free. It cannot. The better question is whether a mega-event organiser can be honest about the emissions, reduce the avoidable parts, protect people from heat, avoid weak neutrality claims and publish enough evidence for outsiders to judge the result.
That makes the 2026 tournament an ESG (environmental, social and governance) test, not only an environmental one. The same event has to handle climate risk, worker conditions, fan travel, host-city planning, public claims, carbon-market choices and post-event accountability.
Quick answer
| Question | Short answer |
|---|---|
| Why is the 2026 World Cup climate impact unusual? | The tournament has 48 teams, 104 matches, three host countries and 16 host cities, so travel and logistics are central to the footprint. |
| What is likely to dominate emissions? | Travel, especially international and inter-city travel by fans, teams, officials, media and event staff. |
| Why does heat risk matter? | Heat affects players, outdoor workers, fans and volunteers, and it tests whether climate adaptation is built into event governance. |
| Can the World Cup simply offset the footprint? | Offsets may play a role, but broad carbon-neutral claims need strong reduction evidence, clear boundaries, high-quality credits and transparent retirement records. |
| What should readers watch after the tournament? | The final greenhouse gas inventory, assumptions, travel split, reductions, credit use, heat incidents and host-city delivery evidence. |
Data checked
This guide was checked on 17 June 2026 against FIFA sustainability material, current tournament reporting, heat-risk coverage and emissions estimates. Tournament operations, official sustainability reporting and weather conditions can change while the event is live, so treat this as a source-backed guide to the climate questions to watch, not a fixed final footprint.
Why the World Cup matters for climate claims
The World Cup is not only a sports story with an environmental footprint. It is a test of institutional credibility. FIFA is a global body making public sustainability commitments around one of the world's largest events. That puts the tournament in the same family of questions as corporate climate claims, carbon neutral language, carbon-credit quality, transport emissions and disclosure quality.
The 2026 World Cup is also a good case study because the event has expanded. The number of teams has increased to 48, the match count has increased to 104 and the host geography spans Canada, Mexico and the United States. That gives the tournament more sporting reach, but it also makes the climate-management problem harder.
The central judgement is not whether FIFA can make a large tournament look perfect. It is whether FIFA can show the difference between what was unavoidable, what was reduced, what was shifted to public transport, what was offset and what remained.
The scale problem: more teams, more matches, more geography
Scale is the first climate issue. A bigger tournament means more matches, more team movements, more fans, more accommodation, more freight, more broadcasting infrastructure, more security and more workers. Some emissions are directly controlled by organisers, such as venue energy and event operations. Many larger emissions sit outside direct control, especially fan travel.
This matters because mega-event footprints are often dominated by movement rather than stadium lights. If millions of people fly to and across a continent-sized host area, the sustainability result depends heavily on transport planning and the assumptions used in the emissions inventory.
Those footprint estimates are not final accounts, but the direction is clear: travel is the hard part. If the final inventory comes in much lower or higher than independent estimates, the useful question will be why. Did assumptions change, were journeys excluded, did public transport materially reduce local emissions, or did the tournament simply prove harder to contain than its sustainability language suggested?
The emissions question is mostly travel
For readers used to corporate carbon accounting, the useful frame is boundary and control. Venue electricity, temporary infrastructure, catering and waste matter, but the biggest climate question is usually who travels, how far they travel and which journeys are counted.
| Control zone | Examples | How to judge it |
|---|---|---|
| Direct control | Inventory method, claims wording, event procurement, official reporting, tournament operations and venue choices inside FIFA's event boundary. | Did FIFA measure it, reduce it where possible and report the remaining impact clearly? |
| Shared control | Host-city transport, waste systems, public safety, heat-response planning, water access, crowd movement and local delivery. | Did FIFA, local organisers and public authorities show what changed because of the tournament? |
| Influence only | Fan flights, accommodation choices, wider tourism, some media travel and the behaviour of millions of spectators. | Were assumptions transparent, incentives realistic and claims careful about what organisers could not directly control? |
A credible World Cup inventory should separate at least five things:
- international fan travel to the host countries;
- domestic and cross-border travel between host cities;
- team, official, media and organiser travel;
- venue operations, temporary power, accommodation and logistics;
- construction, renovation or long-term stadium effects where they are in scope.
This is where the difference between accounting and claims becomes important. A headline footprint number can look precise while hiding huge uncertainty about attendance, travel distances, flight classes, occupancy, hotel nights, freight and what counts as additional to normal tourism. The final number matters, but the assumptions matter more.
There is also a fairness point. Fans do not all have the same transport options. A host-city public transport plan can reduce local car journeys, but it cannot remove the emissions from long-haul flights. That is why strong reporting should show what organisers influenced directly and what they could only estimate or encourage.
Heat risk is now part of event governance
The climate issue is not only emissions. Heat is a live operating risk for players, workers, fans, volunteers, security staff and broadcasters. This is especially important in cities where heat and humidity can combine during summer matches.
FIFA uses WBGT (wet-bulb globe temperature) as part of heat-stress assessment. WBGT is not the same as air temperature. It takes account of heat, humidity, solar radiation and wind, which makes it more useful for outdoor exertion than a normal weather forecast. Current weather and heat-risk reporting has highlighted two thresholds to watch: 28C WBGT is widely treated by exercise physiologists as risky for high-exertion sport, while FIFA's own threshold for considering action has been reported at 32C.
Heat risk changes what good tournament management looks like. Evening scheduling, hydration breaks, shaded queues, medical response, worker rest, access to water and transport crowding all matter. A stadium may be ready for football while the surrounding work and fan environment is still difficult during a heatwave.
That makes heat adaptation a governance question. The useful test is not whether organisers acknowledge climate change in general. It is whether match schedules, staffing plans, volunteer protocols and fan movement are adjusted for conditions on the ground.
What FIFA's sustainability strategy promises
FIFA's World Cup 2026 sustainability strategy is built around social, environmental, economic and governance themes. On the environmental side, FIFA says the tournament will measure and address greenhouse gas emissions, prepare an inventory, promote energy efficiency and renewable energy, support public transport and reduce environmental impacts across preparation, staging and post-tournament reporting.
That strategy is broader than emissions. It also points to waste, water, biodiversity, sustainable procurement, human rights, accessibility and host-city action plans. Each host city has its own environmental plan and human-rights action plan, while FIFA's framework includes forums and convenings intended to coordinate sustainability work.
The critical detail is delivery. Strategy documents set the standard by which the tournament can later be judged. They do not prove the standard has been met. The post-tournament report will be important because it should show what was measured, what changed and what evidence supports the claims.
The carbon-neutral lesson from Qatar 2022
The previous men's World Cup left a useful warning. Qatar 2022 was promoted with carbon-neutral language, but those claims came under scrutiny. A Swiss advertising regulator later found that FIFA had not sufficiently substantiated some climate-neutral claims and should avoid making similar unqualified claims unless it can prove them.
The lesson is not that carbon credits can never be used. The lesson is that neutrality claims need a high evidential bar. If a tournament emits millions of tonnes of carbon dioxide equivalent, readers should be told the boundary, the calculation method, the reduction actions, the credits used, the project types, the standards, the retirement records and what emissions remain outside the claim.
That is the same principle that applies to a company, product or delivery service. The larger the claim, the stronger the evidence needs to be. A cautious statement such as "we measured these emissions and retired these credits for this boundary" is much easier to defend than a broad claim that implies the event has no climate impact.
What good reporting would show after the tournament
The most useful sustainability report after the World Cup would not just celebrate initiatives. It would let readers test the tournament's claims. That means publishing enough detail for the numbers to be understood, challenged and compared.
| Evidence area | What to look for | Why it matters |
|---|---|---|
| Inventory boundary | Which emissions sources were included and excluded. | A footprint without a boundary can understate the real impact. |
| Travel split | International, inter-city and local travel shown separately. | Travel is likely to dominate the total and needs transparent assumptions. |
| Reduction actions | Public transport use, energy choices, logistics changes and waste outcomes. | Readers need to see actual changes, not just commitments. |
| Heat management | Scheduling, hydration, worker protections, medical incidents and lessons learned. | Climate adaptation is part of the event's social and governance footprint. |
| Credit use | Standards, project types, vintages, serial numbers and retirement records. | Credit quality and claim wording decide whether offset-backed claims are credible. |
The best reports also admit uncertainty. Fan travel estimates are inherently difficult. Weather varies. Some host-city actions will work better than others. A transparent report can still be positive, but it should avoid pretending that a continent-scale tournament has been made simple.
How to read World Cup sustainability claims
The practical test for any World Cup sustainability claim is the same one readers can use for corporate green claims.
- Check the boundary: Does the claim cover the whole tournament, one host city, one stadium, one supplier or one initiative?
- Separate reductions from offsets: Was the emission avoided, reduced, shifted to cleaner transport or offset after the fact?
- Look for numbers and dates: Does the claim name the reporting year, method, activity data and evidence?
- Ask who controls the action: FIFA, host cities, stadium owners, transport authorities, suppliers and fans all sit in different control zones.
- Watch the wording: Broad claims such as "carbon neutral" or "climate friendly" need much stronger proof than a narrow statement about a specific action.
This approach avoids two weak readings. One is accepting every sustainability statement at face value. The other is dismissing every initiative because the event is large. The better stance is evidence-led: what was promised, what was measured, what changed and what remains unresolved?
Bottom line
Bottom line
The World Cup should not be judged as a slogan or a single footprint number. It should be judged as a system: travel, heat, operations, claims, offsets, host-city delivery and final reporting.
The 2026 tournament is therefore a public test of mega-event climate governance. If FIFA publishes a clear inventory, treats heat as a serious operating risk, avoids overstated neutrality language and shows what actually changed, the event can improve the standard for global sport. If the final evidence is thin, the lesson will be simpler: a bigger tournament needs a bigger proof file.
FAQ
What is the biggest climate issue for the 2026 World Cup?
Travel is likely to be the biggest emissions issue, especially international and inter-city travel by fans, teams, officials, media and staff. Venue energy and waste still matter, but they are unlikely to dominate the total footprint.
Why is heat risk part of the climate impact?
Climate impact is not only about emissions caused by the event. It is also about how climate conditions affect people during the event. Heat and humidity can raise risks for players, outdoor workers, volunteers and fans, so adaptation is part of responsible event management.
Could FIFA call the 2026 World Cup carbon neutral?
It should be cautious. Any broad carbon-neutral claim would need a clear boundary, strong reductions, transparent accounting, high-quality credits and retirement evidence. The scrutiny around Qatar 2022 shows why unqualified climate-neutral language is risky.
Does using carbon credits make the tournament sustainable?
No. Carbon credits can only address a defined residual footprint if they are high quality and retired properly. They do not replace emissions reductions, heat-risk planning, public transport, waste reduction or transparent reporting.
What should the final sustainability report include?
It should include the emissions boundary, activity data, travel assumptions, host-city results, heat-risk lessons, reduction measures, credit purchases, retirement records and a clear explanation of what was outside the inventory.
Useful source links
- FIFA World Cup 26 Sustainability and Human Rights Strategy
- FIFA environmental pillar
- Guardian: 2026 World Cup carbon footprint scrutiny, bid estimate, travel split and Swiss regulator context
- Guardian weather tracker: WBGT thresholds, heat, humidity and storms
- Guardian: worker heat-risk reporting
- Le Monde: independent emissions estimates and air-travel share
- Feature image: ProtoplasmaKid, Wikimedia Commons, Creative Commons Attribution 4.0